Sunday, April 22, 2012

Answers and more on my research

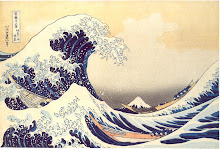
An enormous wave crashed ashore in Japan as a typhoon slams into the country’s northeastern coast in 2011. At least 16 people have died. This is the same area hard hit by the tsunami in March.

Here are some answers to questions students asked about my research.

1. I met my co-author through another Japanese colleague when I was visiting him at the Center for Spatial Information Science at Tokyo University. I had read Dr. Zaiki's articles before and knew she might have some interest in historical typhoons. We communicate by email. I visit Japan every summer and she usually comes to St. Louis each year as well.
2. I can speak and read some Japanese and Dr. Zaiki can speak and write English very well.
3. We have been working on this project for about five years. It takes a long time to collect data, do the analysis, and do presentations and write papers. We can often publish parts of the research as we go along. One of our papers was published in the international journal Weather in 2009 (Reconstructing typhoons in Japan in the 1880s from documentary records).


4. I became interested in typhoons because my PhD dissertation research was about flooding in Japan and typhoons are the major cause of flooding.
5. One of the most interesting parts of my research is reading English-language newspapers published in Japan from the 1850s to 1890s. It is very interesting to read about events in Japan and the world during this time. Things were changing very fast in Japan as it opened to the west during these years. Also, it is amazing how similar newspaper stories are to those we read today.
6. Doing research is part of the job of a professor so we need to make time for it. Summers are a good time for me since I don't teach in July and early August. Anyway, I like doing research so I can find time and the money to do it.

Another project, we have been working on involves "Typhoon tracks around Japan from 1951 to 2011." We are using Geographical Information Systems software to map and classify typhoon tracks around Japan so we can use this information to better understand typhoons we have been researching in the 19th century.

Here is a link to a really interesting site about typhoons - Digital Typhoon

Here are some images we made with ESRI's software ArcGIS.
Pacific Coast Typhoons around Japan 1951-2009
General Pacific Coast type typhoon tracks
General typhoon tracks around Japan 1951-2009


Monday, April 2, 2012

Speaking of the Ocean

James Cameron Now at Ocean's Deepest Point

Explorer-filmmaker reaches Mariana Trench on deepest ever solo sub dive.

A shipboard crane lowers Cameron's sub into the Pacific around 2 a.m. Monday, local time.
Photograph by Mark Thiessen, National Geographic.

Last month, the filmmaker James Cameron (Titanic, Avatar) took a trip to the deepest part of the ocean - the Mariana Trench. He was the first human to reach the 6.8-mile-deep (11-kilometer-deep) undersea valley solo. Previously, in 1960, two men (Jacques Piccard and Lieutenant Don Walsh) descended to the bottom in the Trieste.

For the story of this dive, see Man’s Deepest Dive.

For more on what he did and where he went see James Cameron Completes Record-Breaking Mariana Trench Dive.

While thousands of climbers have successfully scaled Mount Everest, the highest point on Earth, only two people have descended to the planet’s deepest point, the Challenger Deep in the Pacific Ocean’s Mariana Trench. Read about the The Mariana Trench.

 
Map courtesy National Geographic Maps East of the Mariana Islands is the deepest gash on the planet's surface, the Mariana Trench (shown here in dark blue), which formed where the Pacific Ocean collides and dives under the Philippine Plate. The Challenger Deep is near the southern end.

Wednesday, March 28, 2012

Ocean Currents Animation

Perpetual Ocean


Check out these amazing animations of the world's surface ocean currents.

This visualization shows ocean surface currents around the world during the period from June 2005 through December 2007. The visualization does not include a narration or annotations; the goal was to use ocean flow data to create a simple, visceral experience.

Click on "This visualization" to go to page with links to the movies. Choose a file size to suit the type of internet connection you are using. Smaller sizes download faster. Turn on the sound. It is set to music.

This visualization was produced using NASA/JPL's computational model called Estimating the Circulation and Climate of the Ocean, Phase II or ECCO2.. ECCO2 is high resolution model of the global ocean and sea-ice. ECCO2 attempts to model the oceans and sea ice to increasingly accurate resolutions that begin to resolve ocean eddies and other narrow-current systems which transport heat and carbon in the oceans.The ECCO2 model simulates ocean flows at all depths, but only surface flows are used in this visualization. The dark patterns under the ocean represent the undersea bathymetry. Topographic land exaggeration is 20x and bathymetric exaggeration is 40x.

Monday, February 27, 2012

My Research and what I did at the AAG Conference

From Thursday Feb. 23 to Saturday Feb. 25, 2012, I attended the Annual Meeting of the Association of American Geographers in New York City (my former hometown) to present a paper on my research. This is part of what university professors, graduate students and some undergraduates do and part of our professional life. Research and publication is one of the responsibilities of full-time university professors.

About 5000-7000 geographers usually attend this meeting including some graduate students and undergraduate geography majors. Other faculty and graduate students from the SIUE Geography Department also attended.

At these meetings, we usually give 15-20 minute presentations about some research topic that we are working on. My research is about typhoons (hurricanes) in the western North Pacific area around Japan. Because there aren't good weather records from before the 20th century, I (and a Japanese colleague) work on trying to assemble a record of typhoons by looking at historical documents such as diaries, journals, newspapers and government documents. Many of these records in Japan go back to 1600 when the Shogun unified Japan.

This year, I gave a talk entitled, "Typhoon affecting Japan 1880-1899." My coauthor (Dr. Masumi Zaiki from Japan) and I use old newspapers like this one from October, 1891 mentioning a typhoon that hit Japan the previous month
We also use old weather maps like this one from October 7, 1899 which shows a typhoon affecting Tokyo on that day.
This kind of research will help us better understand typhoons in general and how climate change might affect them in the future. We expect to finish the period from 1860-1899 next year and publish the research in an international journal.

Doing research is really interesting. I usually go to Japan each summer to work on this type of project and other projects.

Monday, February 6, 2012

Mapping the Ocean Floor, Science Daily and the US Geological Survey

Google Earth Ocean Terrain Receives Major Update: Data Sharpen Resolution of Seafloor Maps, Correct 'Discovery' of Atlantis From Science Daily (Feb. 2, 2012)

Sounding tracks around Hawaii: Lines depicting where ship-based soundings have been made radiate from the Hawaiian Islands. They are part of an update of Google Earth's ocean terrain. (Credit: Image courtesy of Scripps Institution of Oceanography)

ScienceDaily (Feb. 2, 2012) — Internet information giant Google updated ocean data in its Google Earth application this week, reflecting new bathymetry data assembled by Scripps Institution of Oceanography, UC San Diego, NOAA researchers and many other ocean mapping groups from around the world. The newest version of Google Earth includes more accurate imagery in several key areas of ocean using data collected by research cruises over the past three years. Check out Google Earth.

"The Google map now matches the map used in the research community, which makes the Google Earth program much more useful as a tool for planning cruises to uncharted areas," Sandwell added.

For example, the updated, more precise data corrects a grid-like artifact on the seafloor that was misinterpreted in the popular press as evidence of the lost city of Atlantis off the coast of North Africa.


Science Daily is a good way to keep track of the latest science news including climate and climate change, geography and geology. Bookmark it or do an RSS feed.

Another interesting map of Hawaii from a US Geological Survey Publication.

Hawaii's Volcanoes Revealed by Barry W. Eakins, Joel E. Robinson, Toshiya Kanamatsu, Jiro Naka, John R. Smith, Eiichi Takahashi, and David A. Clague

Prepared in cooperation with the Japan Marine Science and Technology Center, the University of Hawai‘i, School of Ocean and Earth Science and Technology, and the Monterey Bay Aquarium Research Institute.
The Japan Marine Science and Technology Center (JAMSTEC) funded and led a four-year collaborative survey of the underwater flanks of Hawaii's shield volcanoes. This exploration, involving scientists from the U.S. Geological Survey (USGS) and other Japanese and U.S. academic and research institutions, utilized manned and unmanned submersibles, rock dredges, and sediment piston cores to directly sample and visually observe the sea floor at specific sites. Ship-based sonar systems were used to more widely map the bathymetry from the sea surface.

The state-of-the-art multibeam sonar systems, mounted on the hull of GPS-navigated research vessels, convert the two-way travel times of individual sonar pings and their echoes into a line of bathymetry values across the ship track. The resulting swaths across the ocean bottom, obtained along numerous overlapping ship tracks, reveal the sea floor in stunning detail.

More about this is discussed on the site Hawaii's Volcanoes Revealed.


We will talk more about HI volcanoes soon.

Diamonds are minerals


Diamonds
Fotografiert von Mario Sarto 04. Februar 2004


Volcanic Pipe
American Museum of Natural History


What do these pictures have in common?

Diamonds form under high pressure and heat in the mantle 150-200 km (93-125 miles) below the surface. They don't form on the surface. The the pressure is too low. The stable form of carbon on the surface is graphite.

Diamonds get to the surface in magma from deep in the mantle. This magma erupts in small, but violent, volcanoes. Below these volcanoes are "pipes" filled with volcanic rock, pieces of the mantle, and some diamonds. The rock is called kimberlite after the city of Kimberley, South Africa, where the pipes were first discovered in the 1870s. Click here to see this in action.

In the last 20 years scientists have discovered new sources of diamond. Continental collisions -- a result of plate tectonics -- can subject slices of a crust to immense burial and uplift. In Kazakhstan, for example, diamonds formed in buried crust that returned to Earth's surface. Meteor impacts produce immense pressures, and diamonds can be formed and sprayed among the impact debris. Meteorites also experience impacts themselves and can contain diamonds. (Source:
American Museum of Natural History)

There is some really interesting history on this site.

Africa is the richest continent for diamond mining, accounting for roughly 49% of world production. More about where we find diamonds.


Famous, Historic and Notable Diamonds and some good info about how diamonds are evaluated.

Sunday, January 22, 2012

Some thoughts on the Universe

Here is some interesting stuff about the beginning of our universe and the Earth that we don't have time to talk about in this class.

The Oldest Light in the Universe


Feb. 11, 2003: NASA today released the best "baby picture" of the Universe ever taken; the image contains such stunning detail that it may be one of the most important scientific results of recent years. Scientists used NASA's Wilkinson Microwave Anisotropy Probe (WMAP) to capture the new cosmic portrait, which reveals the afterglow of the big bang, a.k.a. the cosmic microwave background. For the story visit
The Oldest Light in the Universe.

A full-sky map of the oldest light in the universe. Colors indicate "warmer" (red) and "cooler" (blue) spots. The oval shape is a projection to display the whole sky; similar to the way the globe of the earth can be represented as an oval. Credit: NASA/WMAP Science Team

For some really good stuff about Cosmology and the Universe, check out NASA's Universe 101 and the pages linked to it.

To see the Cosmic Microwave Background (CMB) for yourself, turn on your TV.

Fraser: So if we had a big enough telescope, we could look out to the very edges of the universe and see that light in all directions, right? You're looking back in time, so if you look far enough back in time, you would see in all directions, right?

Pamela:
In fact, it's not so much about a big enough telescope, as a telescope capable of seeing in the right colours. In fact, your television antenna, is (at a certain level) a big enough telescope. When you see static in your television, part of that static you're seeing is light from the moment when the universe cooled off enough that the photons could go flying off on their own.


These quotes are from the transcript of a from a podcast Ep. 5: The Big Bang and Cosmic Microwave Background on Astronomy Cast.


Birth of a Planet
According to the Big Bang theory, the formation of our home planet began about 13.7 billion years ago with a cataclysmic explosion that created all matter and space almost instantaneously. Read the rest in our text on pp. 598-601.


Some videos related to this stuff on YouTube


Cosmic Dark Age - a time without stars - Death Star - BBC Horizon science

Birth of the Solar System

Hubble's Expanding Universe Red Shifts The Big Bang


For a good read about the Big Bang and how we learned a lot of this stuff, I recommend Simon Singh's Big Bang and Neil DeGrasse Tyson's book Origins which also has a PBS website with lots of links to interesting stuff.